The Results of the Monitoring Surveys in 2007-2008
1 Survey period
From April 2007 to March 2008
2 Survey method and result (see Appendix 1 for more details)
10
x 10m grids were set up on the surveyed beaches and all beached marine litters
within the grids were collected and sorted into 8 different litter categories
(e.g. plastic, glass, etc.). The number and weight of marine litter in each
category were then counted and measured. The overall results of the FY 2007
survey are as follows: Total survey area: 62,534m2, total number
of collected litter: 126,041, total weight of collected litter: 1,478,297.8g.
3 Participating organizations
Surveys were conducted mainly through local governments, with support
from various NGOs/NPOs, and eEcology Childrenfs Clubsf. In FY 2007, a total of
36 local governments and 3,517 people participated.
4 Survey beaches
Surveys on beached marine litter were conducted along coast
of China, Japan, Korea and Russia, a total of 83 beaches.
5 Survey results
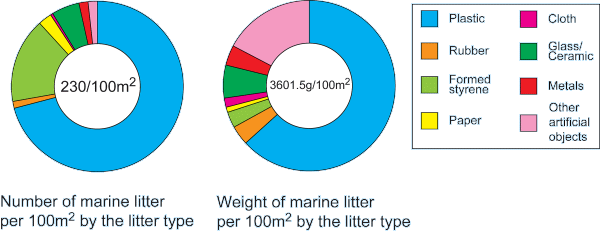
Figure 1 shows the average number and weight of collected marine litter
per 100m2 by litter type. In the FY 2007 survey, of 230 pieces of marine litter
were collected per 100 m2, and approximately 71 % (163/230 pieces) was plastics. The second most
abundant litter type was Styrofoam which comprised approximately 16 % of
the litter (37/230 pieces). In terms of weight, plastics were also main
item, approximately 63 % (2,278.2/3,601.6 g) of the total weight of litter.
Other artificial objects (mainly wooden blocks and boards) were the next
largest contributor approximately 17 % (622.4/3601.6 g) of the litter.
The results show that man-made products such as plastics and Styrofoam
made up the major proportion of the collected marine litter in both number
and weight in this region.
Figure 1@Average number and weight of marine litter per 100m2 by litter type
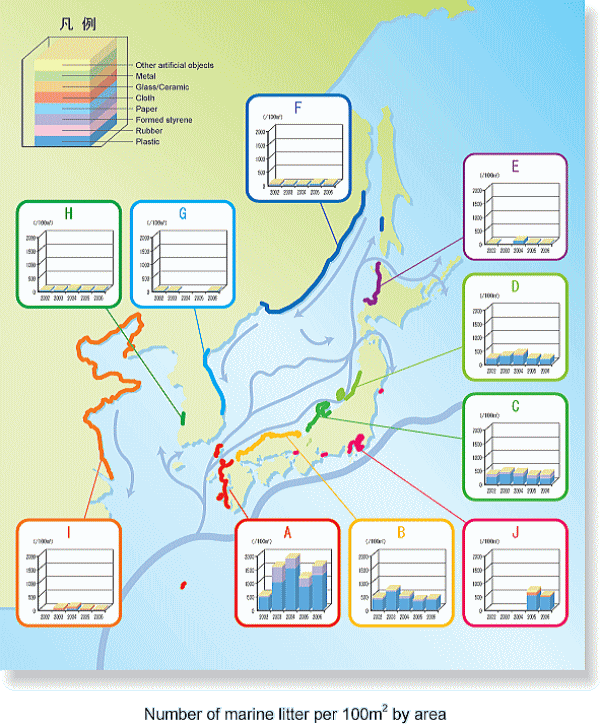
Figure 3@The distribution of marine litter in the NOWPAP region
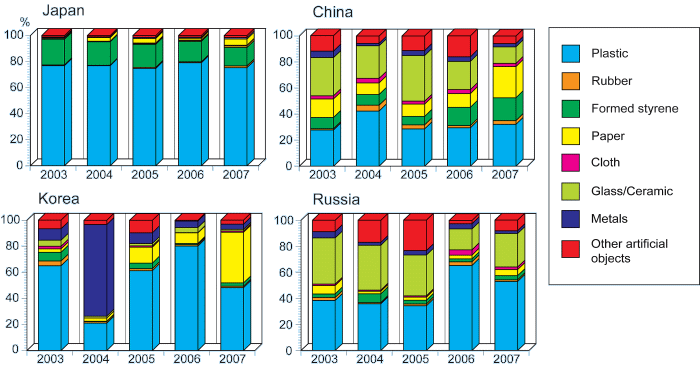
Figure 2@The yearly trend of the composition ratio of marine litter in
NOWPAP member states
@This composition is different in each NOWPAP member state. In figure
2, the yearly trend of the composition ratio of marine litter in each member
state is shown. In case of Japan, plastics and formed styrene items account
for a high percentage of marine litter. On the other hand, in China and
Russia, glass and ceramic items are major marine litter. In addition, it
is one characteristic that paper items are found in China and Korea.
Figure 3 shows the distribution of marine litter in the NOWPAP region.
With regard to the regional distribution of marine litter, Area A had the
largest number of marine litter per 100 m2 (637 pieces), followed by Area D (325 pieces). Areas E-I had relatively
small number of marine litter. There was a decrease in the abundance and
weight of marine litter sampled in the northern locations compared to the
southern parts.


